


Kenyan Banks FY 2022 Results
KCB Group’s asset base hits KES 1.554T

👋 Welcome to The Mwango Weekly by Mwango Capital, a newsletter that brings you a succinct summary of key capital markets and business news items from East Africa.This week, we cover Kenyan banks. and other listed companies' FY 2022 earnings.First off, enjoy a dose of our weekly business news in memes:


Kenyan Banks FY 2022 Earnings
Interest Income Mapping: KCB Group recorded the highest Net Interest Income (NII) at KES 86.7B, up 11.5% year-on-year. Equity Group had the second-largest NII at KES 85.9B, recording a growth of 25%. While Stanbic Holdings had the least aggregate size of NII at KES 18.9B, it posted the highest change from FY 2021 at 31.8%. I&M Group recorded the least change in NII edging higher by 9.9% to KES 22.9B.

Forex Trading Income: I&M posted the largest growth in Foreign Exchange Trading Income in FY 2022, edging higher by 191% to reach KES 5B, accounting for 39.6% of Non-Interest Income [FY 2021: 19.8%]. NCBA recorded the second-largest growth with income from FX rising 147.1% to reach KES 12.5B, accounting for 41.3% of Non-Interest Income [FY 2021: 22.9%]. Equity Group posted the largest absolute amount of FX Trading Income at KES 12.9B, a 58.4% change from FY 2021. DTB had the least absolute size of FX Trading Income at KES 4.3B, up 75.8%.

Loan Book: KCB Group had the largest absolute amount of Loans and Advances at KES 863.3B and posted the largest change from FY 2021 at 27.8%. In terms of allocation on the balance sheet, KCB’s loan book accounted for 55.6% of gross assets down from 59.3% in FY 2021. Equity’s loan book reached KES 706.6B, a growth of 20.2%, to represent 48.8% of the asset base [FY 2021: 45%]. Among the listed banks under review, StanChart had the smallest loan book at KES 139.4B, an increase of 10.7%, to account for 36.6% of the balance sheet [FY 2021: 37.6%]. StanChart was the only bank with a loan book below KES 200B.

Investment in Securities: Equity’s KES 393.9B pile of investment securities remained unchanged from the KES 394B recorded in FY 2021, but only accounted for 27.2% of the balance sheet [FY 2021: 30.2%]. Across the major listed banks, Stanbic recorded the highest jump in its pile of investment securities at 40.3% to KES 83.6B - equivalent to 15% of gross assets [FY 2021: 18.1%]. I&M Group had the highest reduction in securities at 11.7% to KES 96.4B, equivalent to 22.2% of total assets [FY 2021: 26.3%].

Asset Base: KCB Group’s asset base grew by most across the major listed banks at 36.4% to reach KES 1.554T - the largest across East Africa. In the operating period under review, KCB Group acquired TMB bank in DRC, a transaction that helped propel the bank’s asset size to the largest in the region. Equity’s asset base edged higher by 10.9% to reach KES 1.447T. DTB’s asset base inched past the KES 500B mark, growing by 15.4% to KES 526.9B. At 4.8% and 4.7%, NCBA and Co-operative Bank asset bases expanded at the slowest pace to reach KES 619.7B and KES KES 607.2B, respectively.

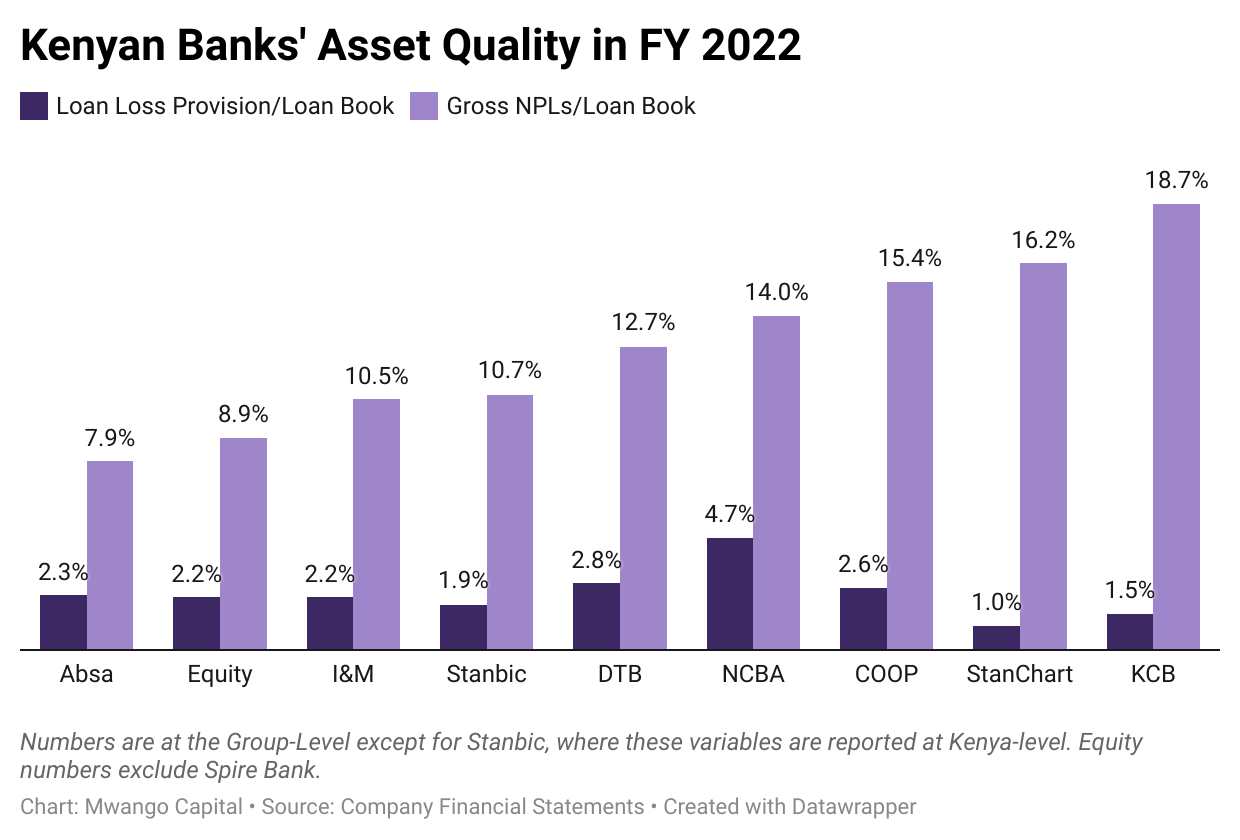
Loan Loss Provisions: All lenders increased provisions through the income statement, except StanChart, where the provisions were down 36.2% to KES 1.3B. Equity recorded the most significant expansion in provisions, up by 163.7% to KES 15.4B. This accounted for 17.9% of its total operating expenses [FY 2021: 9.5%]. Equity, KCB and NCBA had the highest aggregate volume of the provisions at KES 15.4B, KES 13.2B, and KES 13.1B, respectively.
Profitability: On a consolidated basis, the major Kenyan listed banks reported KES 176B in Net Income, up 25.2%. In terms of growth, DTB recorded the largest change in its bottom line rising by 55.1% to KES 6.8B. Despite this growth, the FY 22 net profit position remains lower compared to that of FY 2019 and FY 2018 which stood at KES 7.3B and KES 7.1B, respectively. Equity recorded the largest absolute size of after-tax profits at KES 46.1B but recorded the lowest growth of 15.1% from FY 2021. From FY 2020 to FY 2022, Absa and NCBA tripled their net profit positions from KES 4.1B to KES 14.6B, and KES 4.6B to KES 13.8B, respectively.

Dividends: StanChart Kenya posted the highest dividend in absolute terms at KES 22 per share, a 15.6% increase. The bank also had the highest payout ratio at 69.9%, despite this being a decrease from the 80.9% ratio recorded in FY 2021. KCB Group is the only bank that reduced its dividend as compared to last year, paying KES 2 in dividends per share [Fy 2021: KES 3]. It also posted the lowest payout ratio at 15.7%.

Stock Market Reaction: I&M was the highest gainer in trading action last week edging higher by 22.3% week-on-week to KES 20.85. Below is the price return of the covered banks over the last 1 year.

Related Development: Last week, the CBK hiked the Central Bank Rate by a whopping 75 basis points (bps) from 8.75% to 9,5%.
“The MPC noted the sustained inflationary pressures, the elevated global risks and their potential impact on the domestic economy, and concluded that there was scope for a further tightening of the monetary policy in order to anchor inflation expectations. In view of these developments, the MPC decided to raise the Central Bank Rate (CBR) from 8.75 percent to 9.50 percent.”
CBK Governor, Patrick Njoroge
Some banks have already started adjusting their lending rates to reflect the recent rate hike. Below are some of the updates customers are receiving:
“Dear Customer, following the review of the Central Bank Rate (CBR) by CBK from 8.75% to 9.50%, effective 01/04/23 KCB M-PESA Loan will be charged a fee of 8.85% up from 8.79%.”
Find a consolidated document for Kenyan banks’ FY2022 results here.
KQ FY 2022 Earnings
Operating Highlights: Total revenues for the year ended 31st December 2022 rose by 66% to reach KES 117B, equivalent to 95% of the numbers registered during the pre-pandemic period. The total number of passengers uplifted in the year was 3.7M, up 68% year-on-year while cargo business uplift edged higher by 3.5% to reach 66K Tonnes. Available Seat Kilometres rose by up 75% to 10,303M [FY 2021: 5,900M], 38% lower than pre-pandemic levels.
Earnings Landscape: As a result of a 59% increase in total operating costs to KES 122.4B, the airline booked a KES 5.6B operating loss position, an improvement from the KES 6.8B reported in FY 2021. The Loss Before Tax widened by 2.4X to reach KES 38.3B, and the full-year loss for the year amounted to KES 38.3B [FY 2021: KES 15.9B]. The cumulative losses that have been accrued since FY 2013 stand at KES 138B.
Currency Depreciation: Forex losses resulting from the novation of guaranteed USD debt amounted to KES 18B, equivalent to 15.4% of gross revenues in the year. An increase in fuel prices further weighed down on the operating earnings.
“However, without the significant events of 2022, which included an increase of fuel cost by 160% year on year due to the spike in fuel prices, the financing costs referred to above and the impact of the devaluation of the Kenya Shilling against major world currencies, the airline would have achieved a break-even profit before tax and reported a profit of Kshs 13 billion at the operating level.”

Find a link to the full results here.
Weekly Capital Markets Wrap
The NSE: In Week 13 of 2023, I&M was the top gainer, up 22.3% week-on-week to KES 20.85, while Standard Group was the top loser, down 13.1% to KES 8.52. The NSE 20 and NSE 25 indices fell by 3.7% and 4.8% to 1,622.1 and 2,965.9 points, respectively while the NSE All Share Index gained 1.6% to 112.8 points. Equity turnover was down 94.3% to KES 1.7B while bond turnover fell 63% to KES 19.1B.
T-Bills: In the short-term public debt markets, the weighted average interest rate of accepted bids for the 91-Day, 182-Day, and 364-Day instruments were 9.907%, 10.399%, and 10.8% respectively. The total amount on offer was KES 24B with the CBK accepting KES 8B of the received bids. The aggregate performance rate was 34.4% and the acceptance rate was 33.5%. Investors mostly piled into the 91 Days paper which had a 72.6% performance rate.
Eurobonds: Last week, the yields fell across all 6 outstanding papers on a week-on-week basis.
KENINT 2024 and KENINT 2032 fell the most, down 82.5 basis points (bps) each to 13.636% and 11.329%, respectively. The average decline across the 6 papers stood at 72.8 bps.
All instruments were up on a year-to-date basis. KENINT 2034 was up the highest at 135 bps to 11% while KENINT 2048 expanded the least, rising by 67.6 bps to 11.5%
KENINT 2024 led in terms of price gains year-to-date, appreciating by 0.1% to 92.589 while KENINT 2034 price depreciated the most, down 8.8% to 70.664. On a week-on-week basis, KENINT 2032 appreciated the most, up 5.1% to 81.335. while KENINT 2024 recorded the lowest price appreciation at 1.0%.


Other Market Gleanings
📈 | Limuru Tea Rebounds to Profit | For the fiscal year ended 31st December 2022, Limuru Tea revenues were up 46% to KES 123M. The firm recovered from a loss position of KES 3.7M in FY 2020 and KES 9.6M in FY 2021 to register a net profit position of KES 11.3M. The board of directors recommended a KES 2.5 per share dividend, ending a dividend drought that impacted the 2020 and 2021 fiscal years. The dividend yield stands at 0.625%.
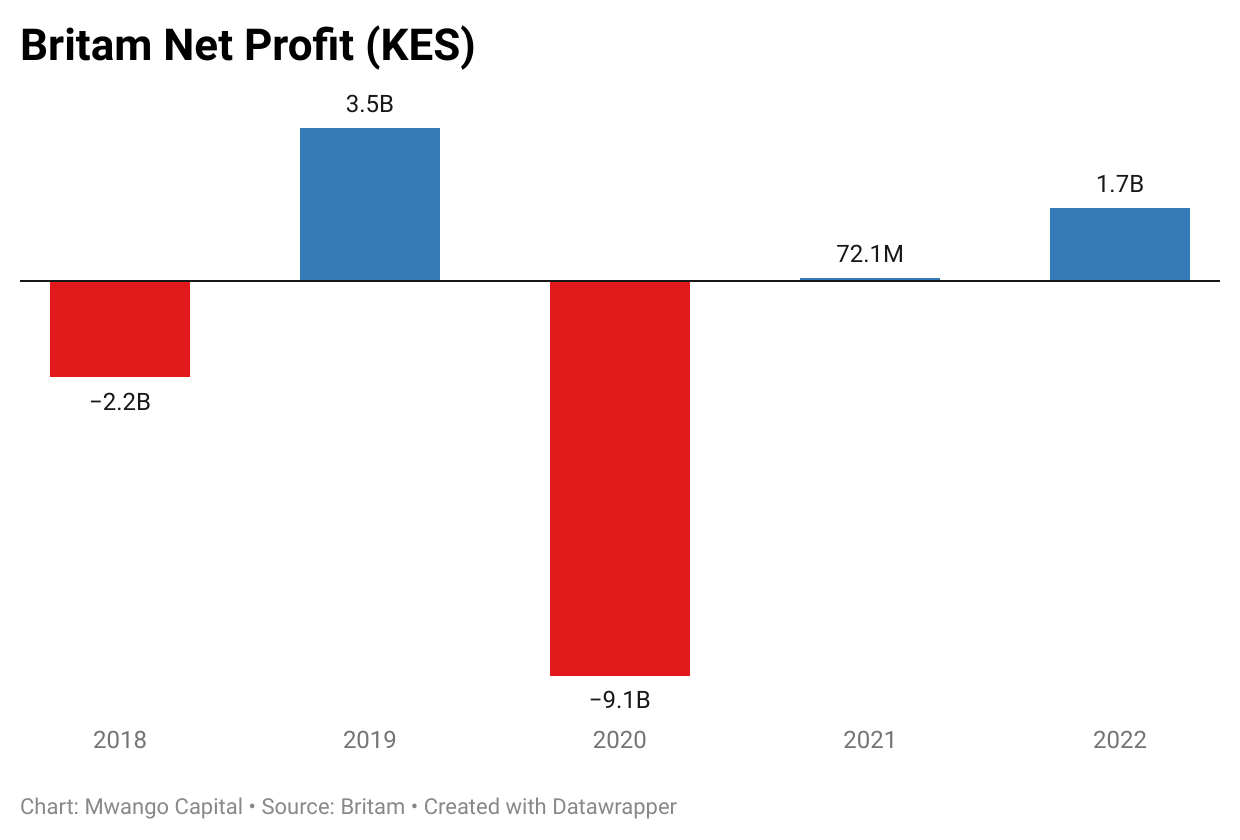
💰 | Britam Net Profit Grows 23X | For the financial year ended 31st December 2022, Gross Earned Premiums rose marginally by 2.7% to reach KES 33.4B while total income fell by 5% to KES 38.2B on account of KES 3.9B losses accrued on the fair value of financial assets. Pre-tax profits increased by 191.9% to KES 2.9B bringing the net income for the year to KES 1.7B. The Board of Directors did not announce a dividend.
💸 | Kenya RE Doubles DPS | In the fiscal year ended 31st December 2022, Gross Premium Written edged higher by 21.9% to reach KES 21.8B, while the total income expanded by 13.9% to KES 24.1B. Net claims and benefits increased by 30.1% to reach KES 13B. Despite the net result for the year falling 0.1% to KES 3.6B, the Board announced a dividend of KES 0.2, to bring the payout ratio to 15.5%. [FY 2021: KES 0.1 DPS, 8.9% Payout Ratio]. Further, Kenya RE announced the appointment of Dr. Hillary Maina Wachinga as Managing Director, subject to regulatory approval.
📉 | ILAM Fahari I-Reit Cuts FY Net Loss | In the fiscal year ended 31st December 2022, Revenue edged higher by 26.8% to reach KES 336.8M, while operating expenses edged higher by 6% to reach KES 243.4B, accounting for 72.3% of total revenues [FY 2021: 86.4%]. The full-year loss was down by KES 96M to reach KES 28.4M.
“The improved performance was mainly attributable to the increase in rental income resulting from the contribution of the anchor tenant at Greenspan Mall for the full year under review compared to five months in the comparative period.”
🗠 | Inflation Stays Flat in March | Kenyan inflation for March 2023 remained flat at 9.2% [Feb 2023: 9.2%]. The Food & Alcoholic Beverages Index rose the most year-on-year at 13.4%, while the Information and Communication Index recorded the lowest growth at 1.2%. Commodity-wise, electricity (50 Kilowatts) jumped the most at 38% while onion (leeks and bulbs) fell by 8.6%.
Charts of the Week

