President Uhuru's Legacy
A summary of Uhuru's economic performance

The legacy of a President lies in the economic performance of the country and changes to institutional frameworks. Below, we summarise Uhuru Kenyatta's economic performance using charts and figures.
Gross Domestic Product
Kenya’s Gross Domestic Product (GDP) increased from KES 4.75T in 2013 to KES 12.1T in 2021, representing a Compounded Annual Growth Rate (CAGR) of 10.96%. During President Kibaki’s regime, the GDP grew at a higher CAGR of 14.84%.

GDP Per Capita
GDP Per Capita grew from $1354.8 in 2013 to $2006.8 in 2021, a CAGR of 4.46%, compared to a CAGR of 12.01% during President Kibaki’s regime.

Revenues vs Expenses
Revenues grew from KES 690.73B in 2012 to KES 2.2T in 2022 with expenses growing from KES 915.89B to KES 3.02T in the same period. Across the Uhuru and Kibaki regimes, revenues have grown at a CAGR of 13.95% and 12.63% respectively.
On the other hand, expenses during the Uhuru and Kibaki regimes grew at a CAGR of 9.12% and 18.48% respectively. The revenue-expenditure mismatch has grown from KES 156.33B in 2013 to KES 820B in 2022. This budget deficit stood at KES 10.3B in 2002.

Public Debt
The country’s debt load has increased from KES 1.79T (36.5% of GDP) in 2013 to KES 8.58T (64.6% of GDP) in 2022. At the onset of President Kibaki’s regime, public debt stood at KES 583.7B (56.4% of GDP) and grew at a CAGR of 10.4% through his two terms.

Current Account
The current account deficit as a percentage of GDP has narrowed from 7.85% in 2013 to 5.20% in 2022. The figure stood at 0.9% in 2002 when Kibaki got into office and widened to 7.85% in 2013 when he left.

Inflation
Inflation for August 2022 was at 8.5% compared to 5.7% in 2013. The average rate of inflation over this period was 6.35%. At the onset of the Kibaki Regime, inflation stood at 2.0% and averaged 10.98% throughout his leadership. From the graph, we observe that the highest levels of inflation were during the electioneering periods of 2017 and 2022 while the lowest levels were immediately after the elections. The variance in the inflation rate can be attributed to CBK’s policies.

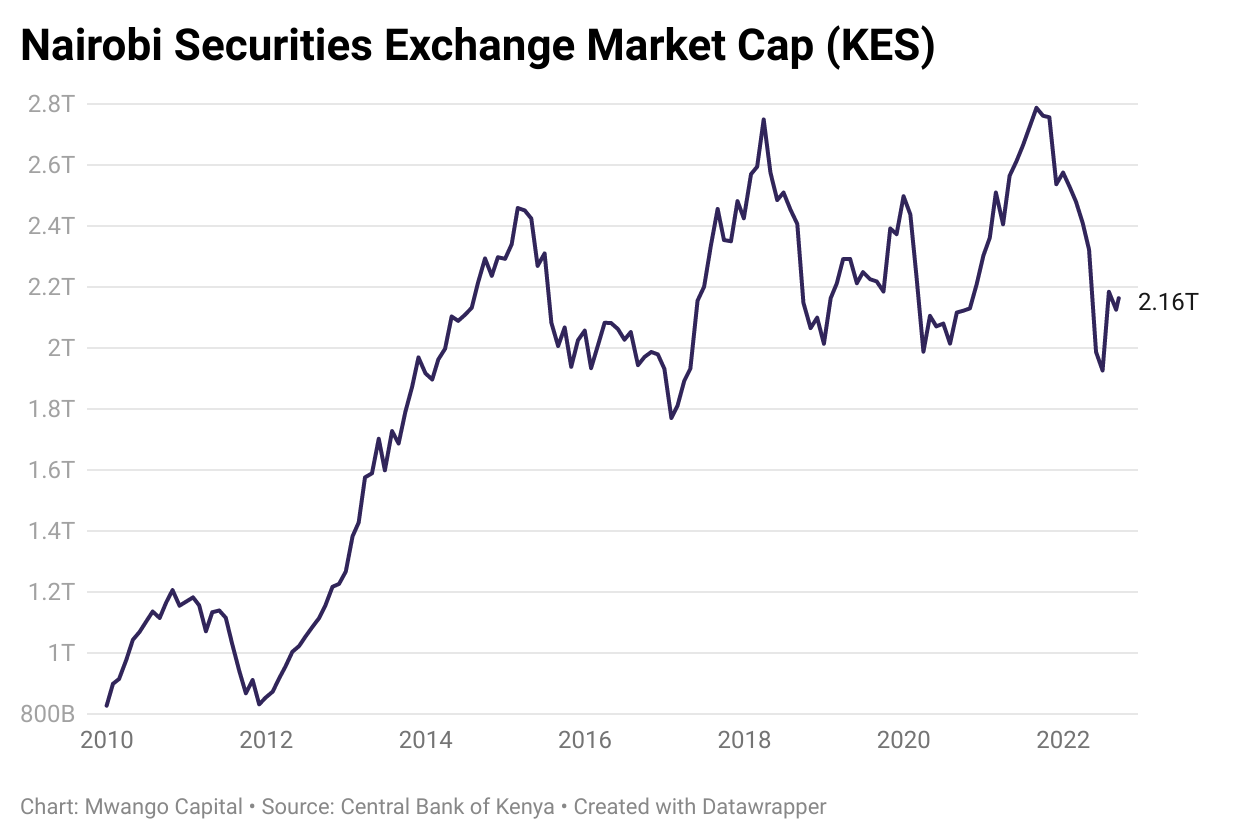
NSE Market Capitalization
The total market capitalization of the Nairobi Securities Exchange (NSE) has grown from KES 1.58T in 2013 to reach KES 2.2T as of market-close Monday this week. Notably, the President never visited the NSE during his tenure. Some of the best-performing stocks in terms of total return during his reign were Safaricom (+627.5%), Kakuzi (+494%), Crown Berger (+362.2%), Car and General (332.1%), and Williamson Tea Kenya (180.7%).
USD/KES Exchange Rate
The Kenya Shilling has lost 30% of its value from 2013 to date, plunging from an exchange rate of 84.70 to 120.71 as of yesterday’s trading, according to data from Bloomberg. In Dec 2002, when Kibaki took office, 1 USD exchanged for KES 77.35. 1 USD exchanged for KES 84.70 when Kibaki left office in Apr 2013.

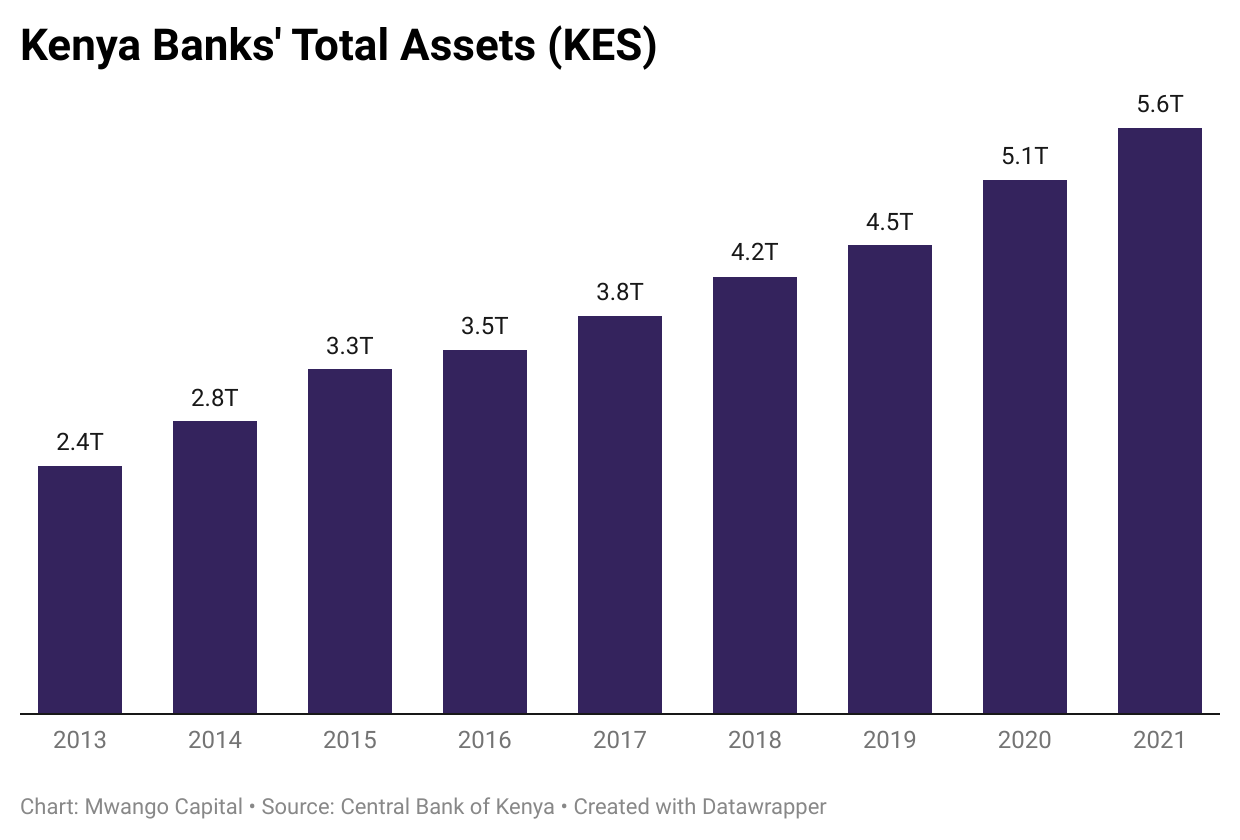
Total Assets
Total assets of the banking system more than doubled from KES 2.4T in 2013 to KES 5.6T in 2021. In September 2016, interest rate caps were introduced which limited the interest banks could charge clients. Overall, the assets grew at a CAGR of 10.02% from 2013 to 2021 and at 8.27% post introduction of the interest rate cap. Total assets of the banking system stood at KES 514.6B in 2002 and grew at a CAGR of 14.88% through Kibaki’s presidency.
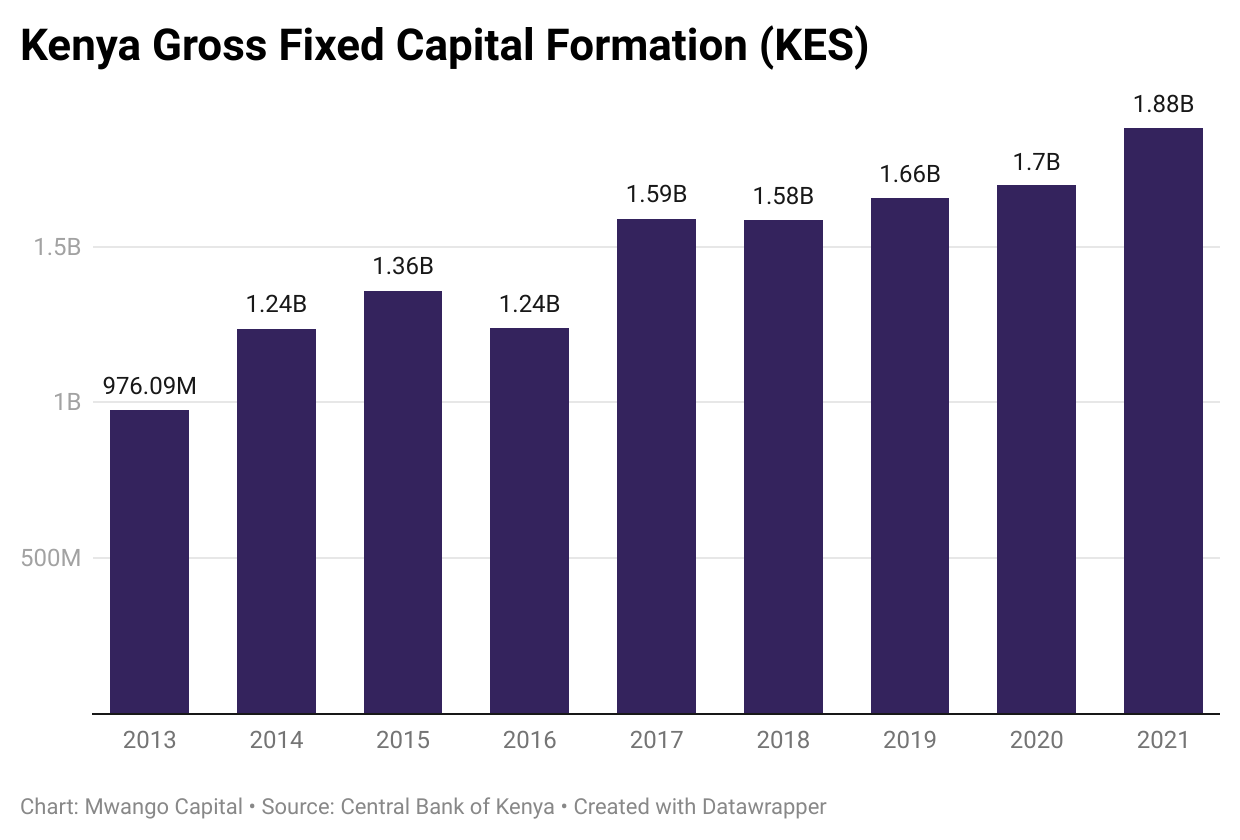
Gross Fixed Capital Formation
The accumulation of fixed capital in the country rose from KES 976.1B in 2013, representing a contribution of 20.6% to GDP, to KES 1.88T in 2021, representing a contribution of 19.6% to GDP.